Cloud Monitoring
- Automatic setup in 5 minutes
- Automatic dashboard and alert configuration
- Well-crafted and user-friendly dashboards
- AI Assistant for Server Configuration
Infrastructure Monitoring
Purpose and setup guide
Real Control Means Reliable Server Performance
Real-time server metrics monitoring eliminates unexpected outages and performance drops. It instantly detects and alerts on critical anomalies like CPU overload, memory shortages, or excessive network traffic. System administrators receive immediate notifications and quickly resolve issues — preventing failures before they happen
Smarter resource use. Higher efficiency
**Server Resource Usage Analysis for Peak Efficiency** Analyzing server resource utilization helps identify inefficient power distribution before it leads to performance issues. Real-time monitoring of CPU, memory, disk usage, and network load allows administrators to fine-tune server configurations, ensuring balanced resource allocation. This proactive approach prevents overloads, reduces operational costs, eliminates downtime risks, and keeps system performance consistently high
Anticipate Load — Prevent Failures
**Resource Usage Analysis Enables Load Forecasting and Scalability** Monitoring how server resources are used makes it possible to forecast future load and prepare for growth in advance. This is essential for websites expecting a surge in traffic or planning large-scale marketing campaigns. Real-time metrics allow administrators to allocate additional resources before issues arise, ensuring consistent uptime and smooth performance even under significant traffic spikes
Respond Instantly — Protect Your Reputation
Monitoring alerts and notifications are a powerful tool for resolving issues and minimizing downtime. The system instantly flags critical deviations — from CPU overload to memory leaks or unexpected spikes in traffic. Admins receive real-time alerts and act immediately, addressing failures before they escalate. This ensures smooth site performance, uninterrupted user experience, and preserves the company’s reputation — even during traffic surges
Scale Smart — Grow Without Downtime
Scaling on Time — Grow Without Disruption Workload analysis and capacity forecasting help prepare your infrastructure for business growth in advance. Server monitoring enables accurate detection of when to allocate new resources, whether that’s additional servers or cloud capacity. This proactive approach prevents overloads and downtime, ensuring your website stays fast and stable—even during spikes in traffic or user activity
Enable Monitoring in 2 Clicks
The system will log in, scan all running services on the server, install monitoring agents for each to collect metrics, create a personalized Grafana dashboard, connect the server and all services, and build individual panels and visualizations. Within 5 minutes, all charts will be ready
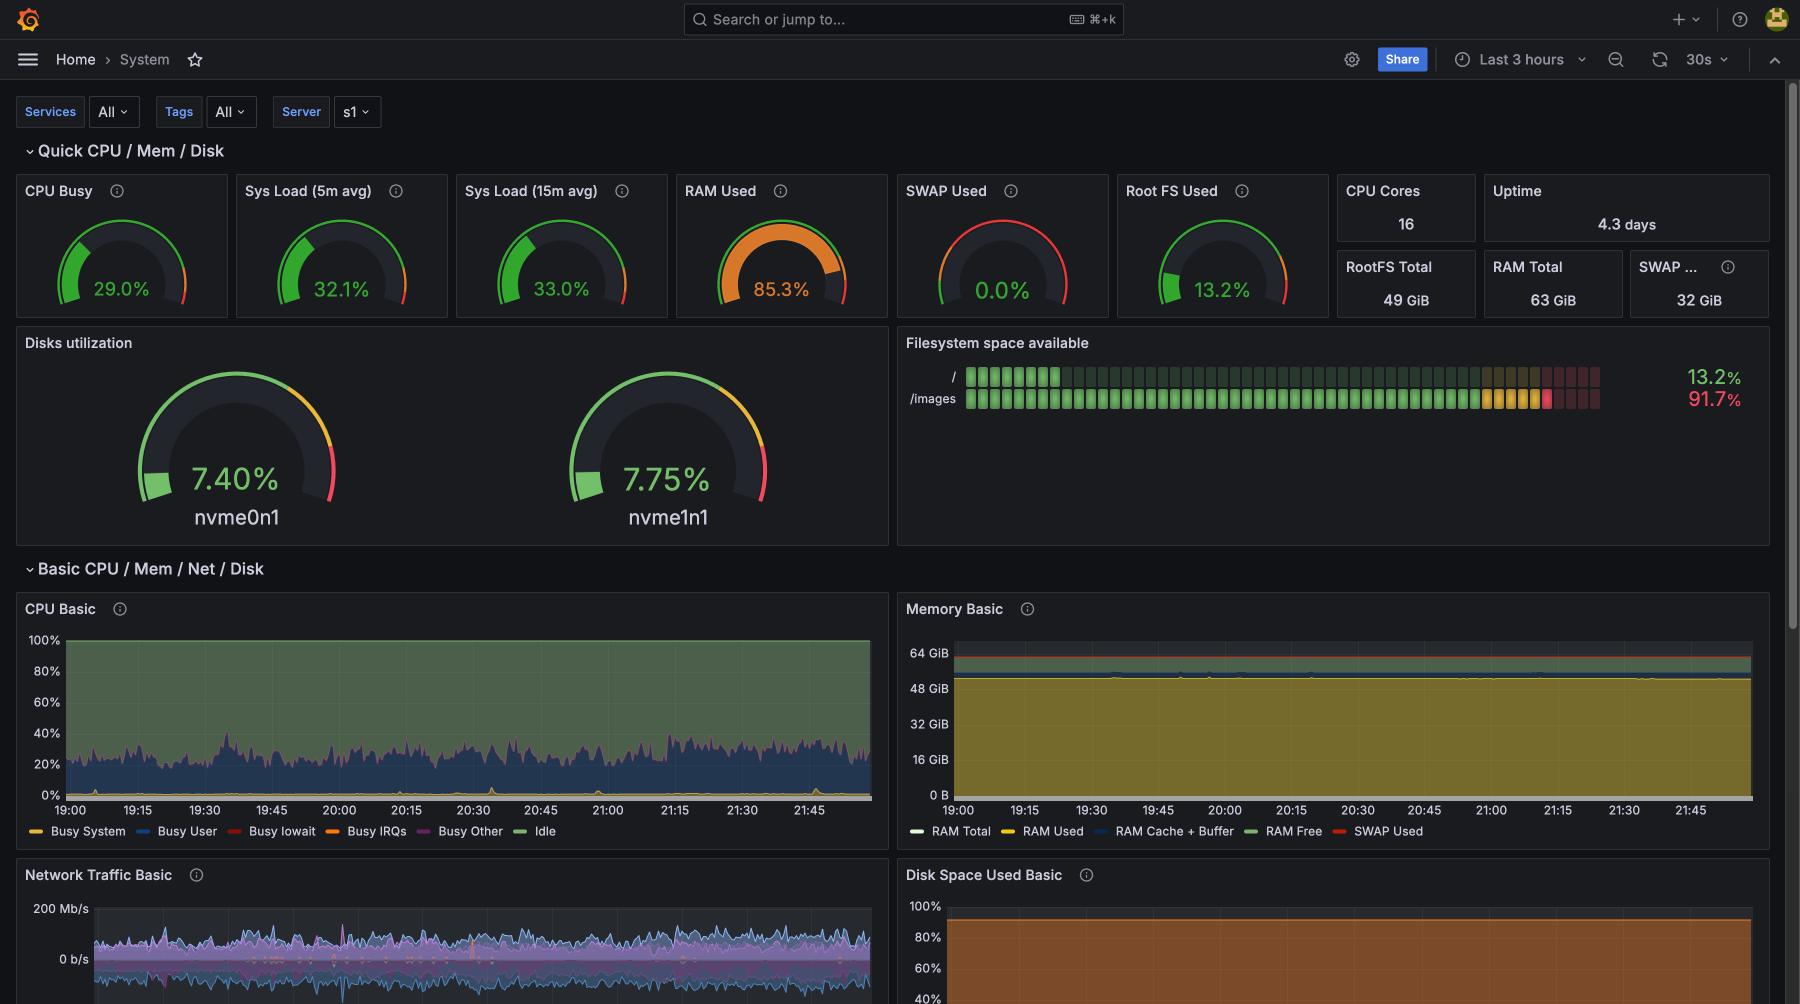
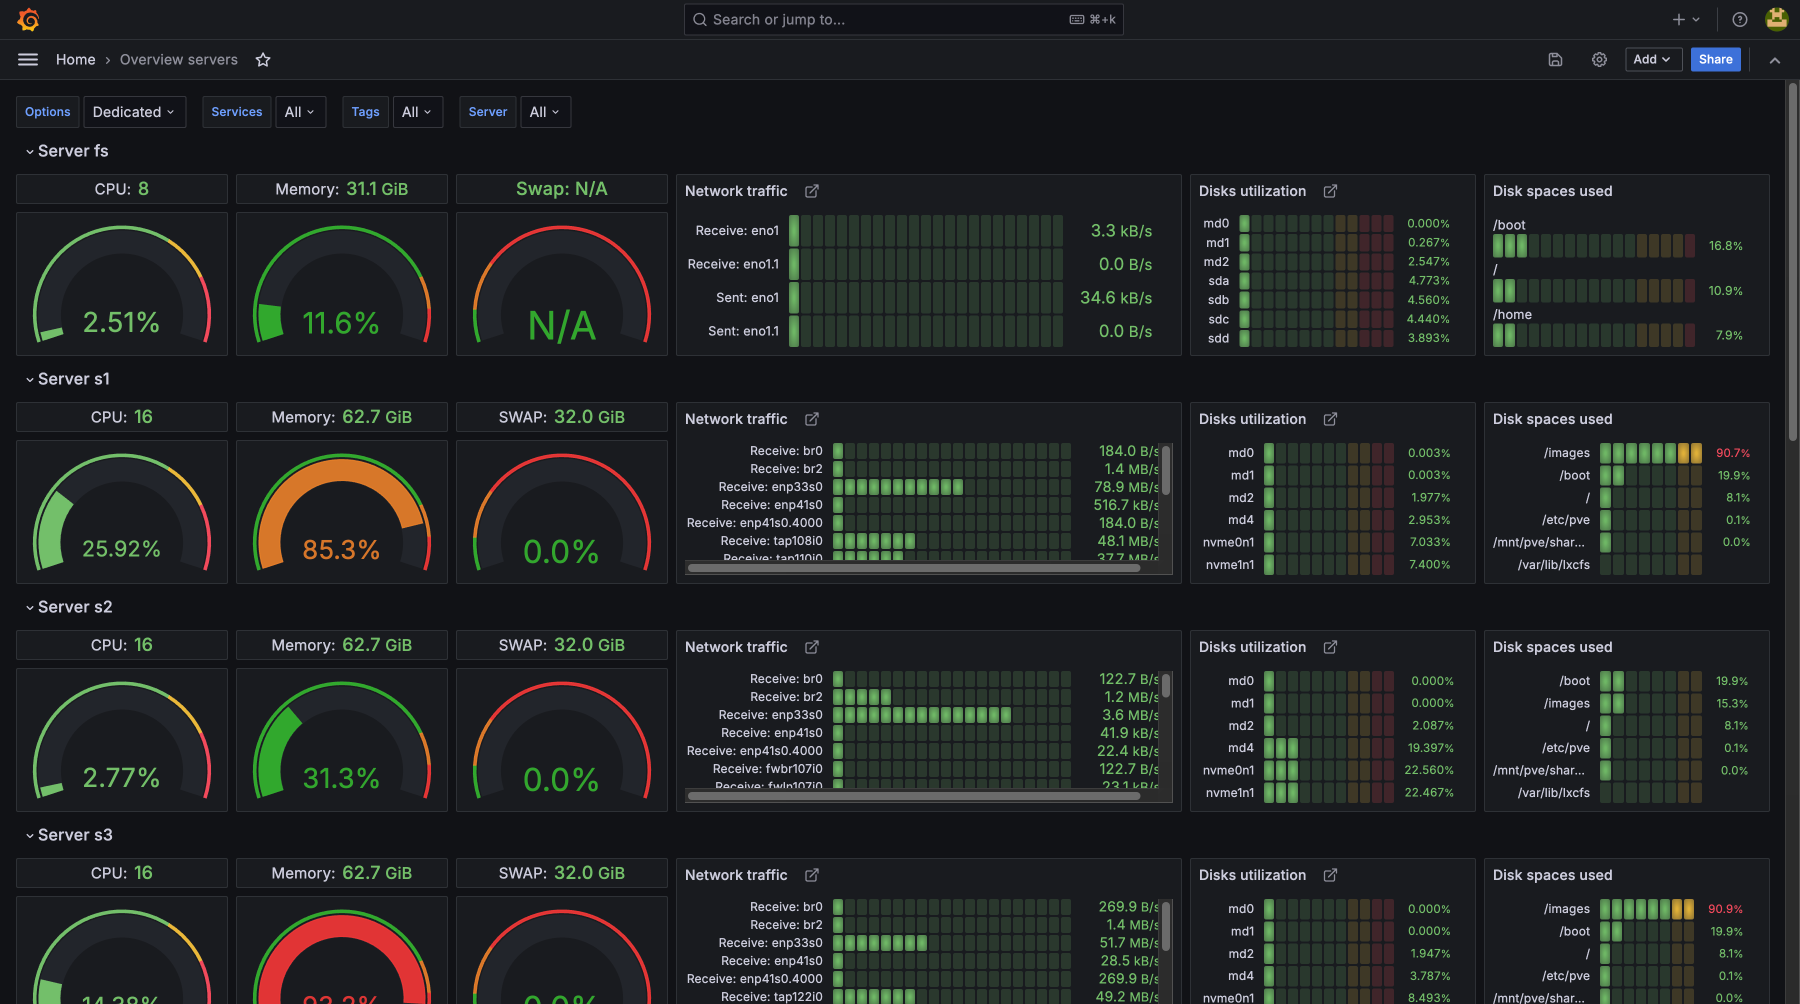
Server Metrics Monitoring:
beyond just CPU, SWAP, memory, and disk usage
Complete control over server, website, and application performance
By monitoring CPU load, memory usage, disk utilization, and network activity, you can proactively prevent failures and eliminate bottlenecks. The monitoring system detects issues before they escalate into critical incidents — ensuring continuous service operation and minimizing downtime. Regular metric tracking allows for precise resource optimization, performance improvements, and maintaining the required levels of security and stability
Monitoring Setup in Just 2 Clicks
Choose Your Preferred Method:
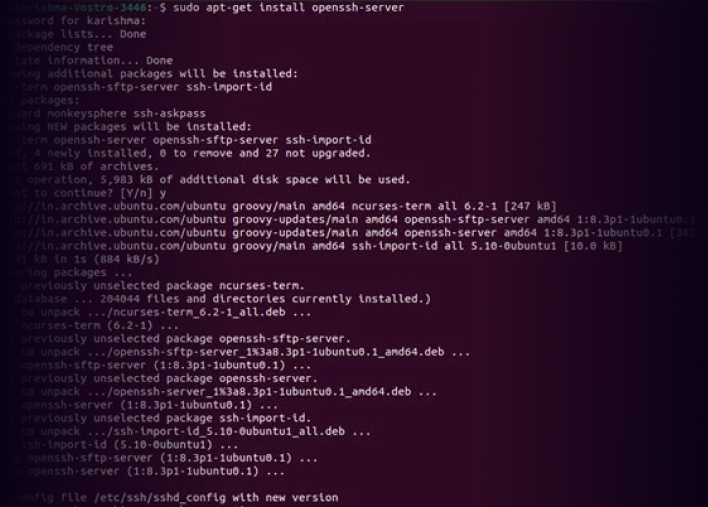
Automatic Installation In the HostAdmin panel, specify SSH access, and the system will automatically install everything needed to transmit metrics.
Manual Installation Paste and run the provided command on your server — the required software will be installed automatically.
HOW TO CALCULATE THE COST?
Our service is among the most affordable on the market.
Just register and add your server — the system will scan it and generate an estimated price.
The cost is calculated automatically based on the volume of transmitted data.
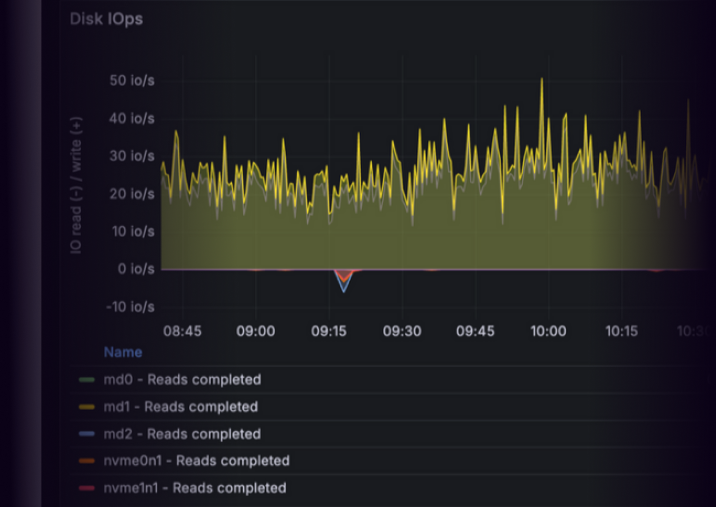
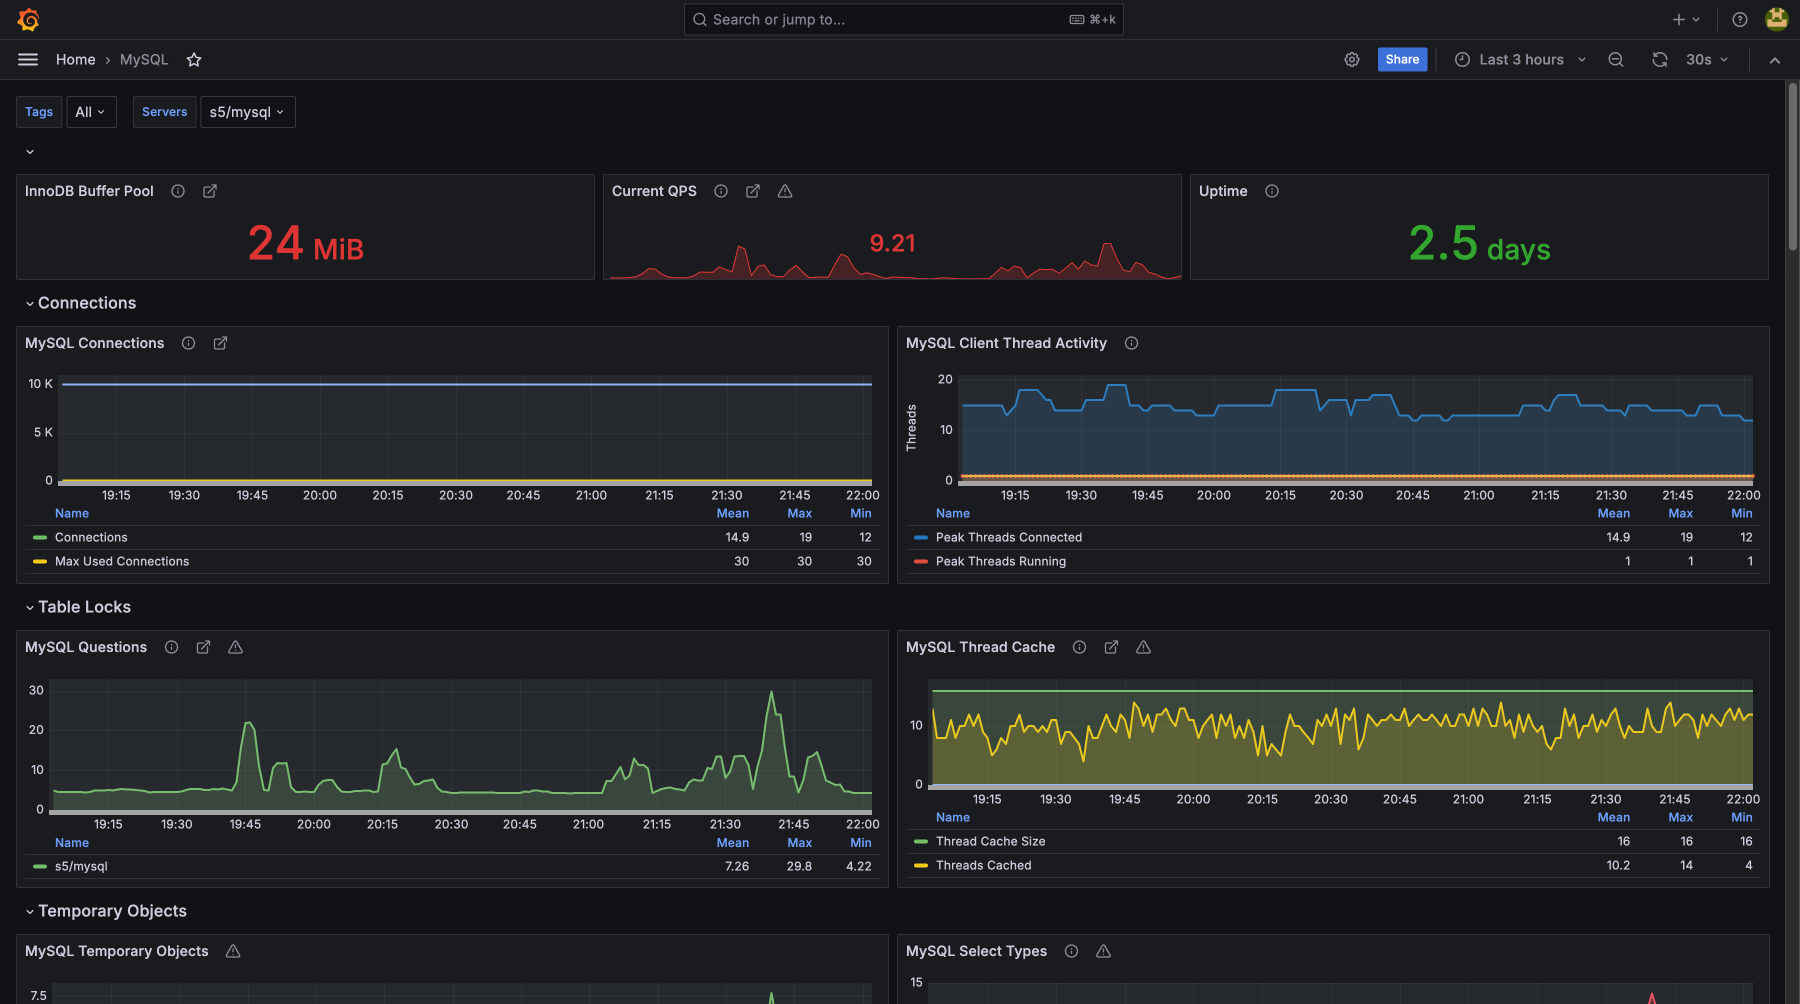
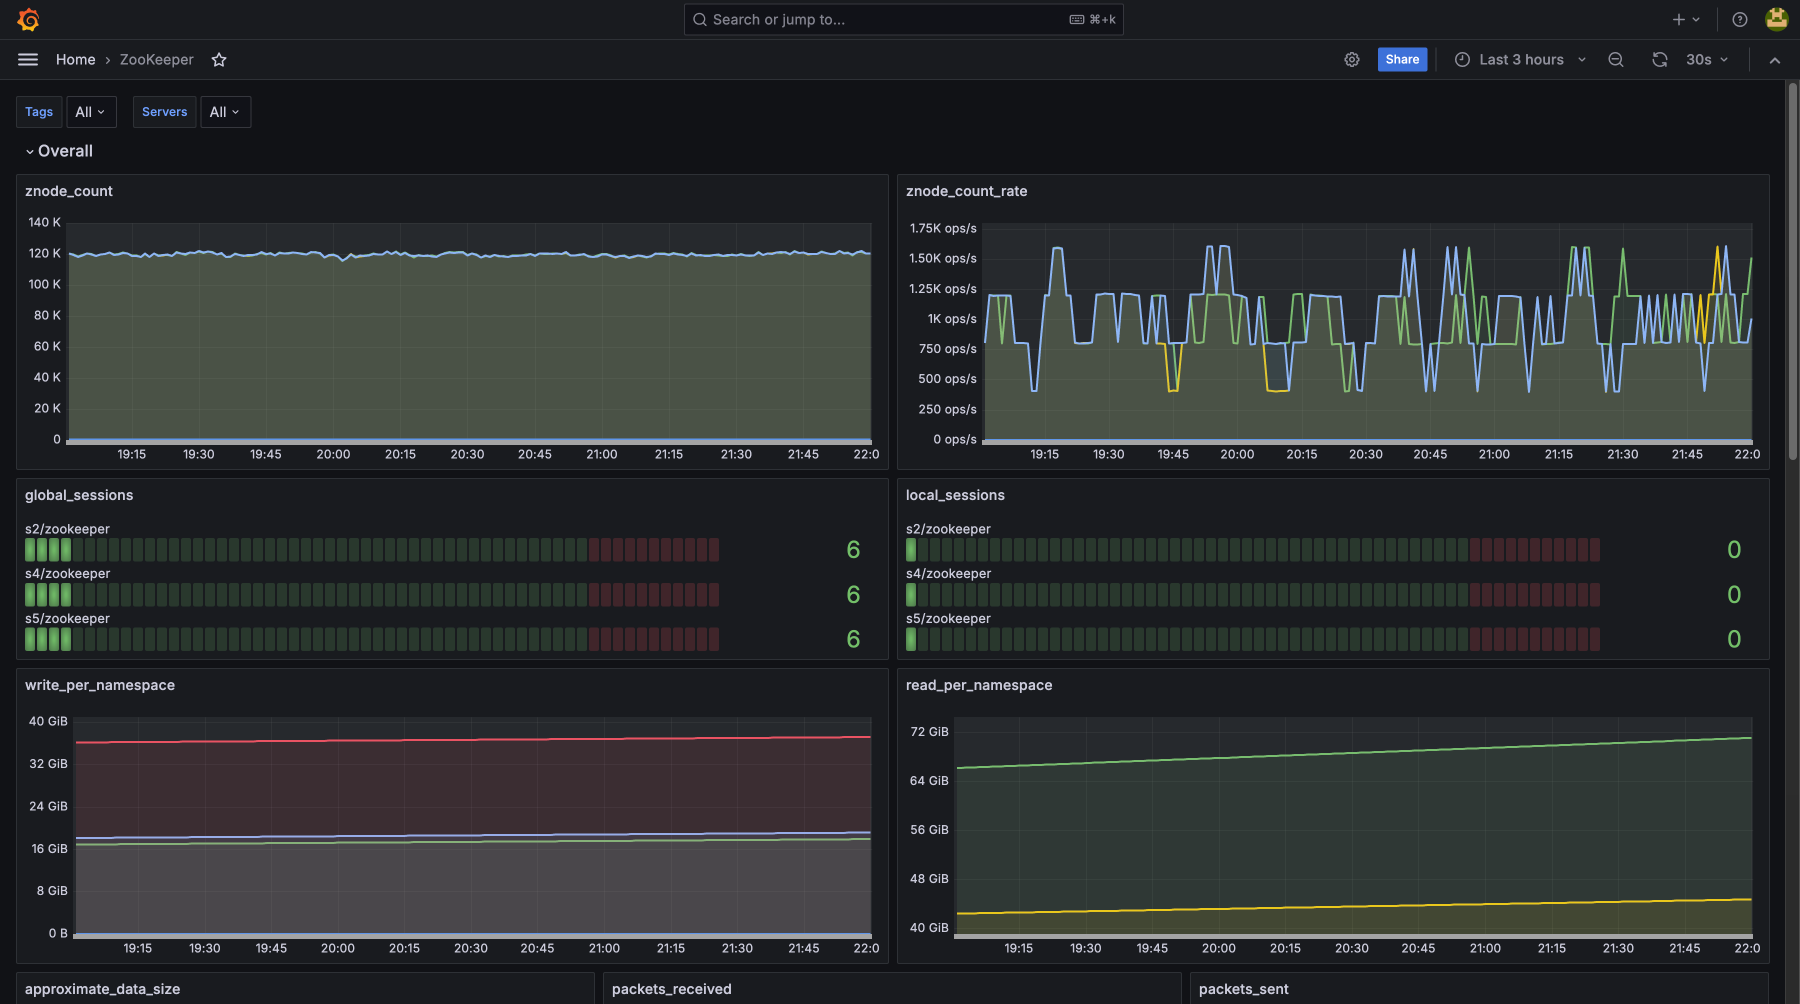
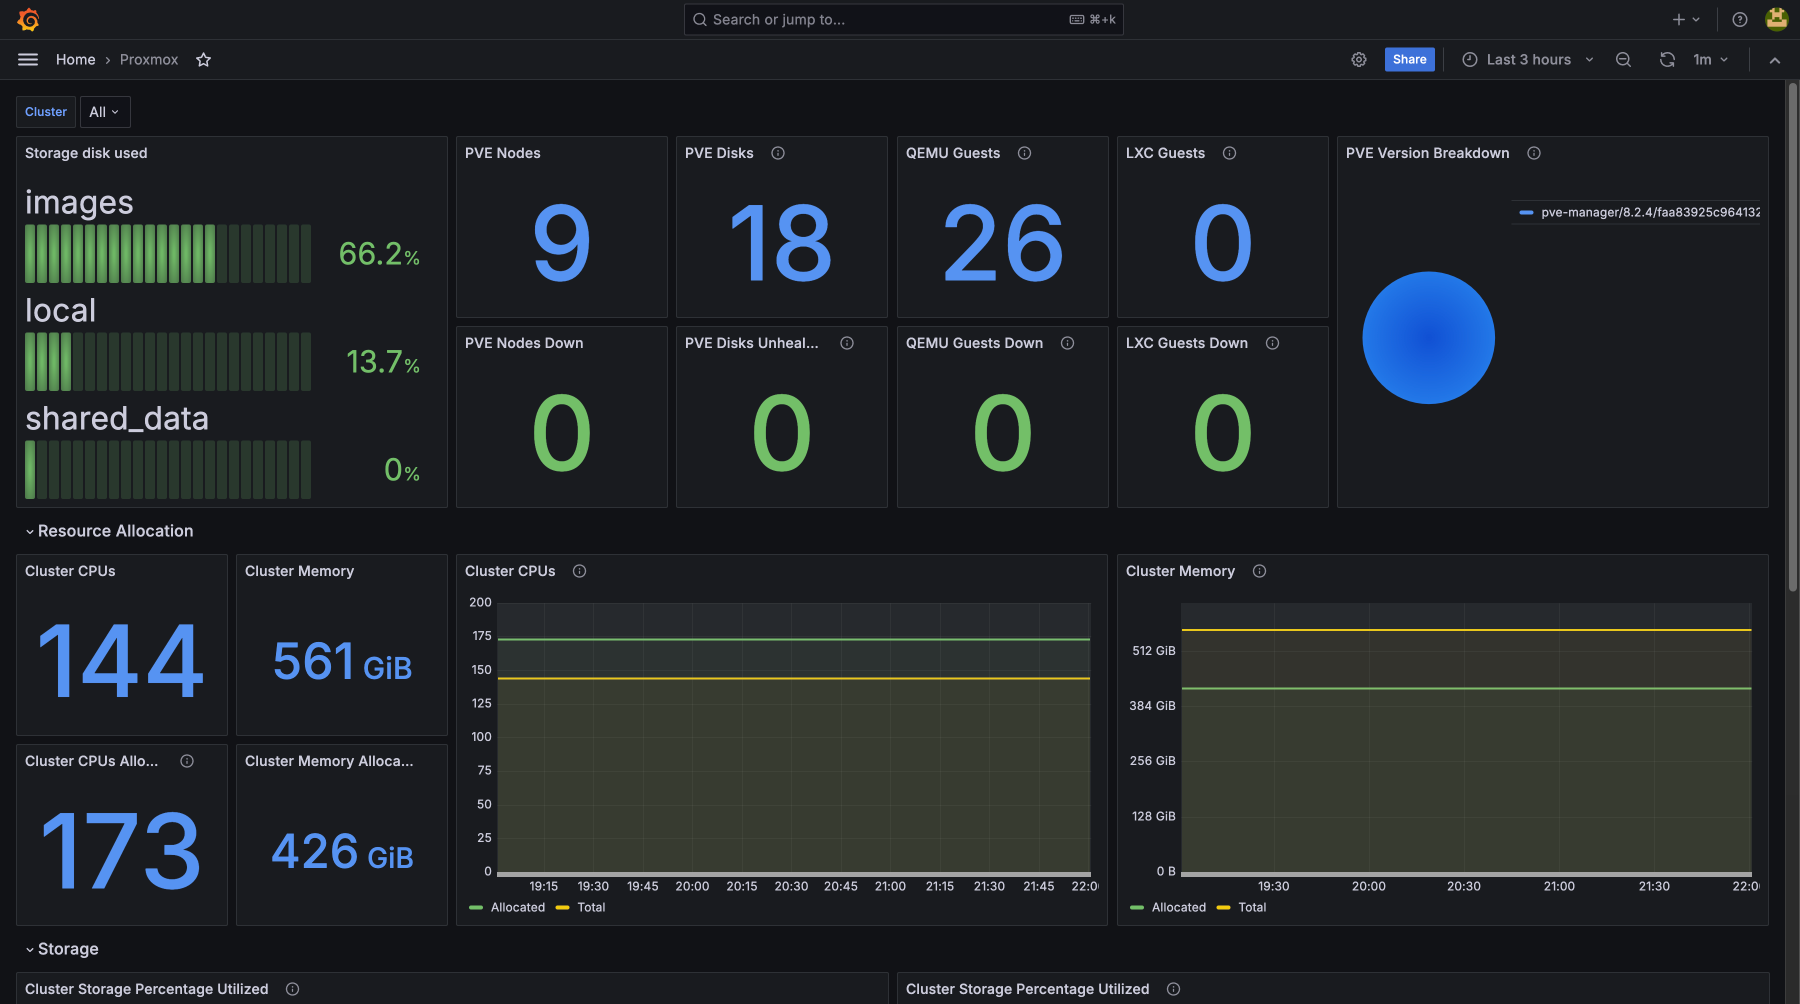
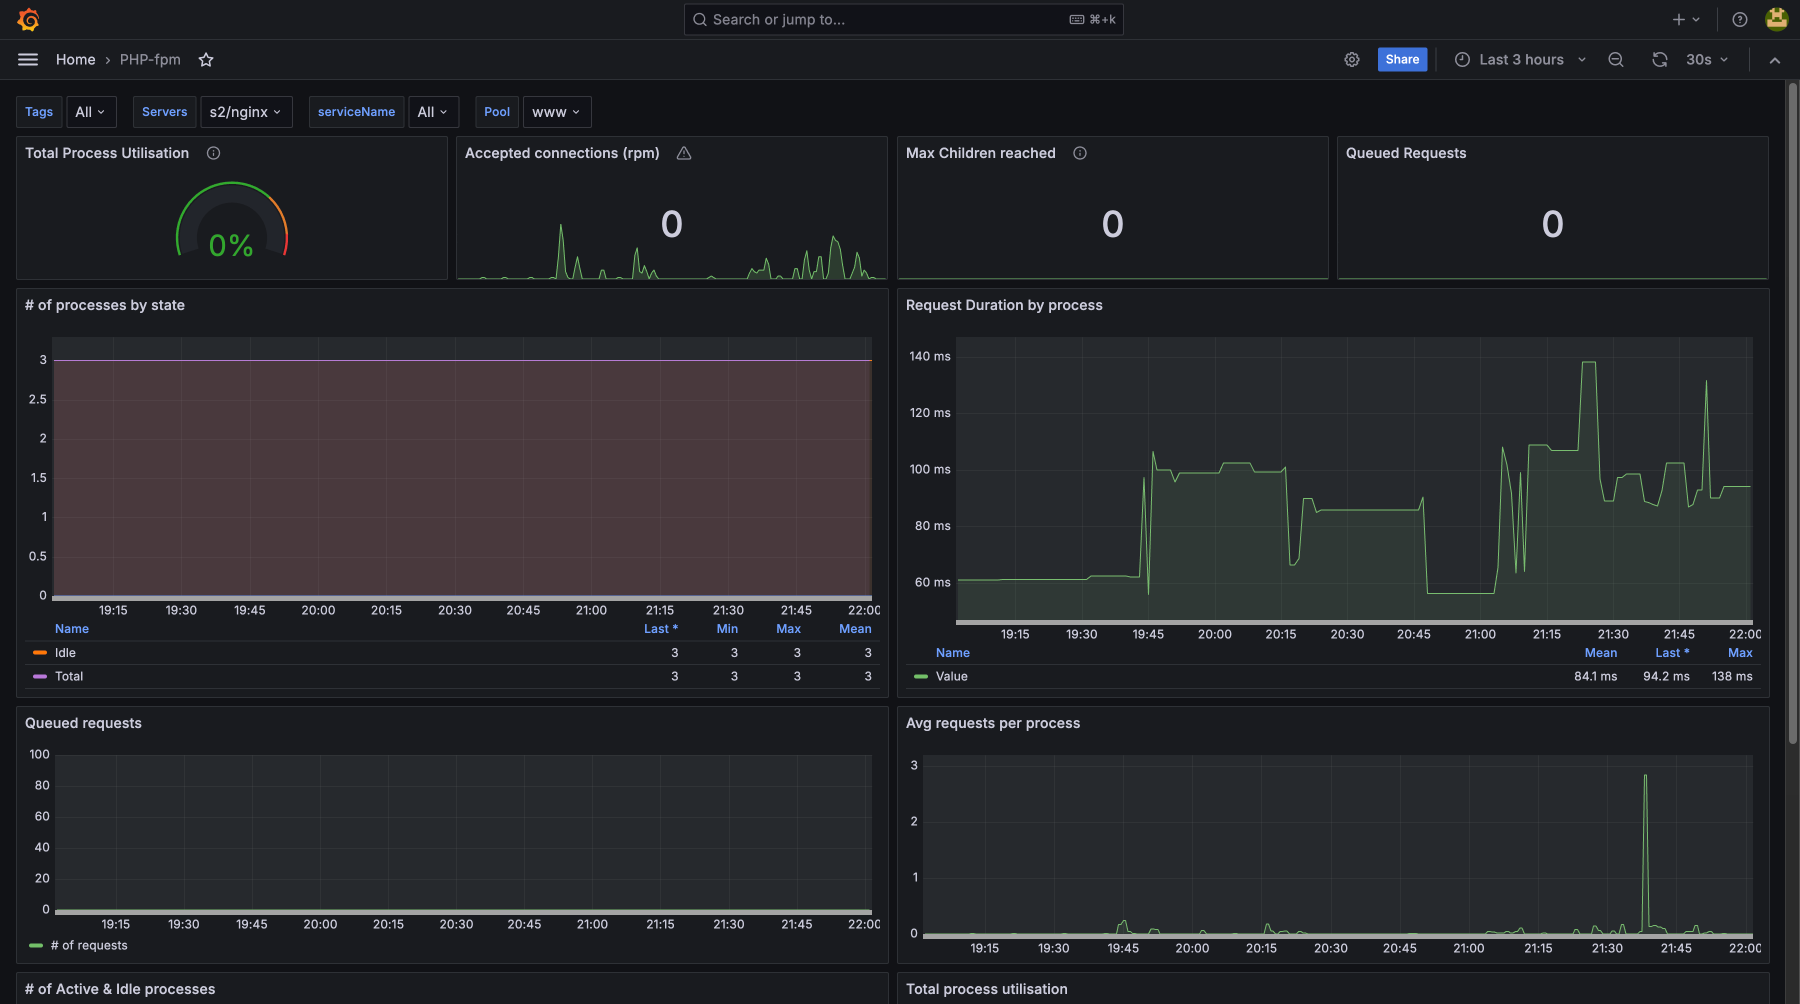
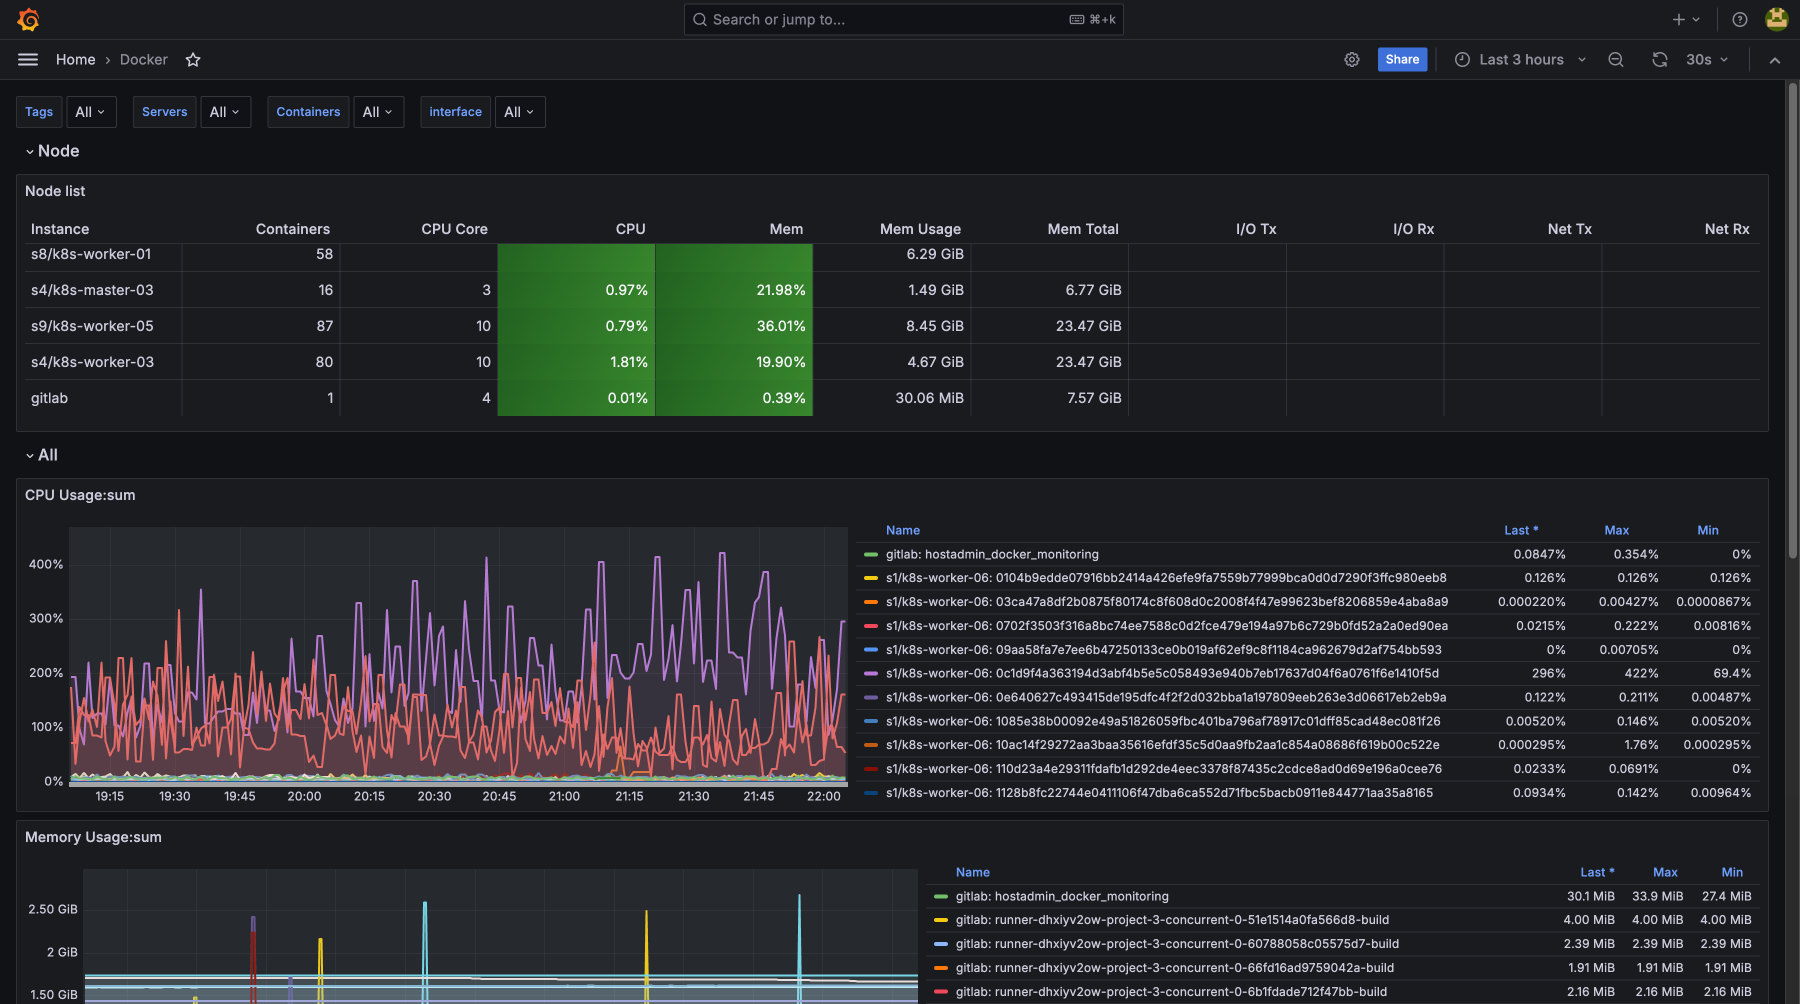
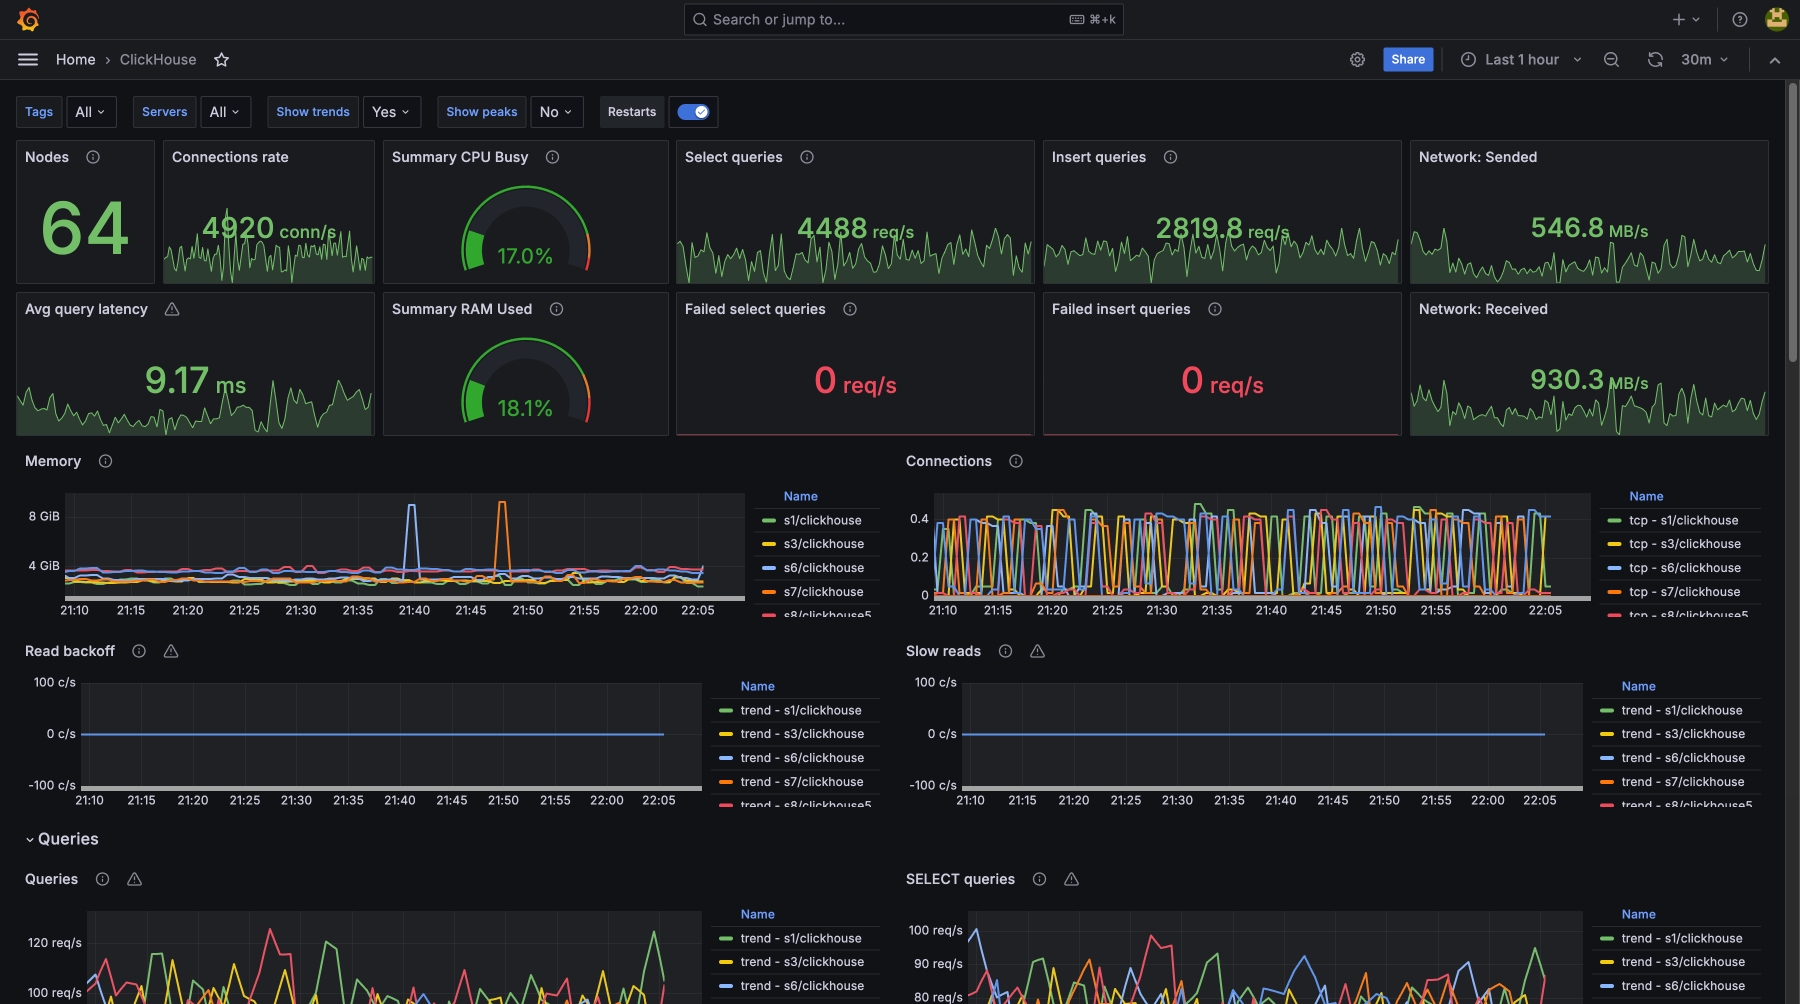
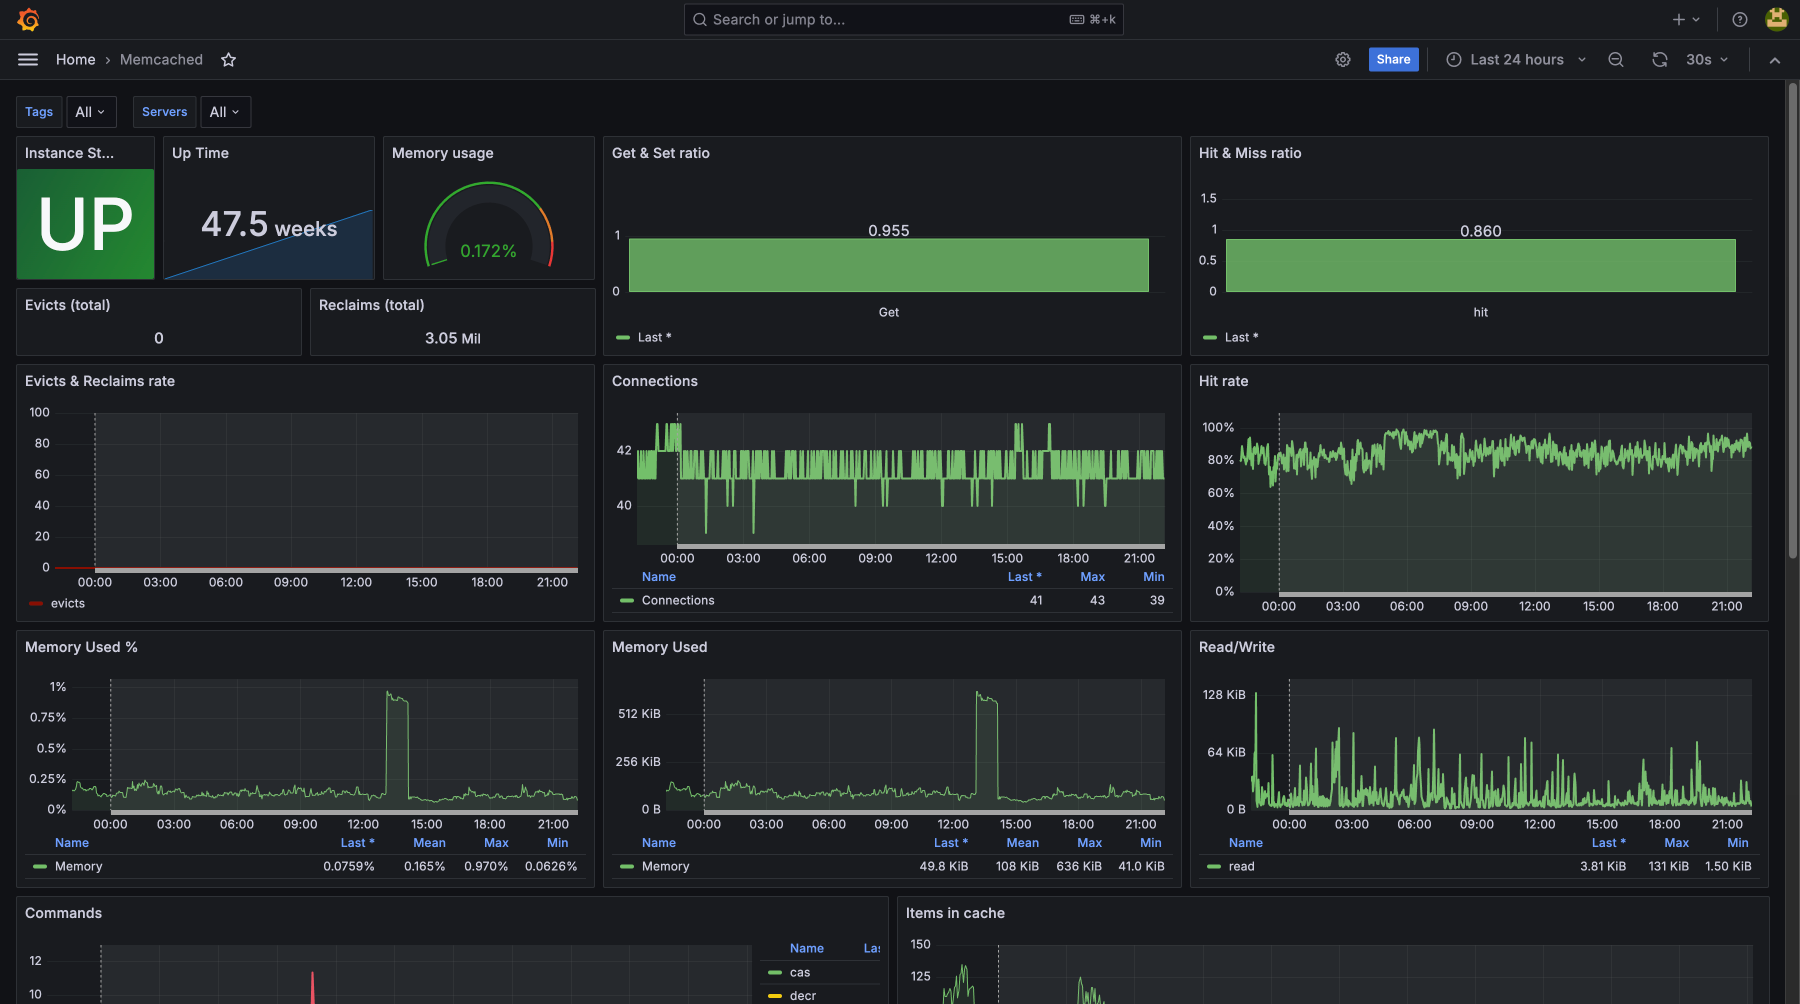
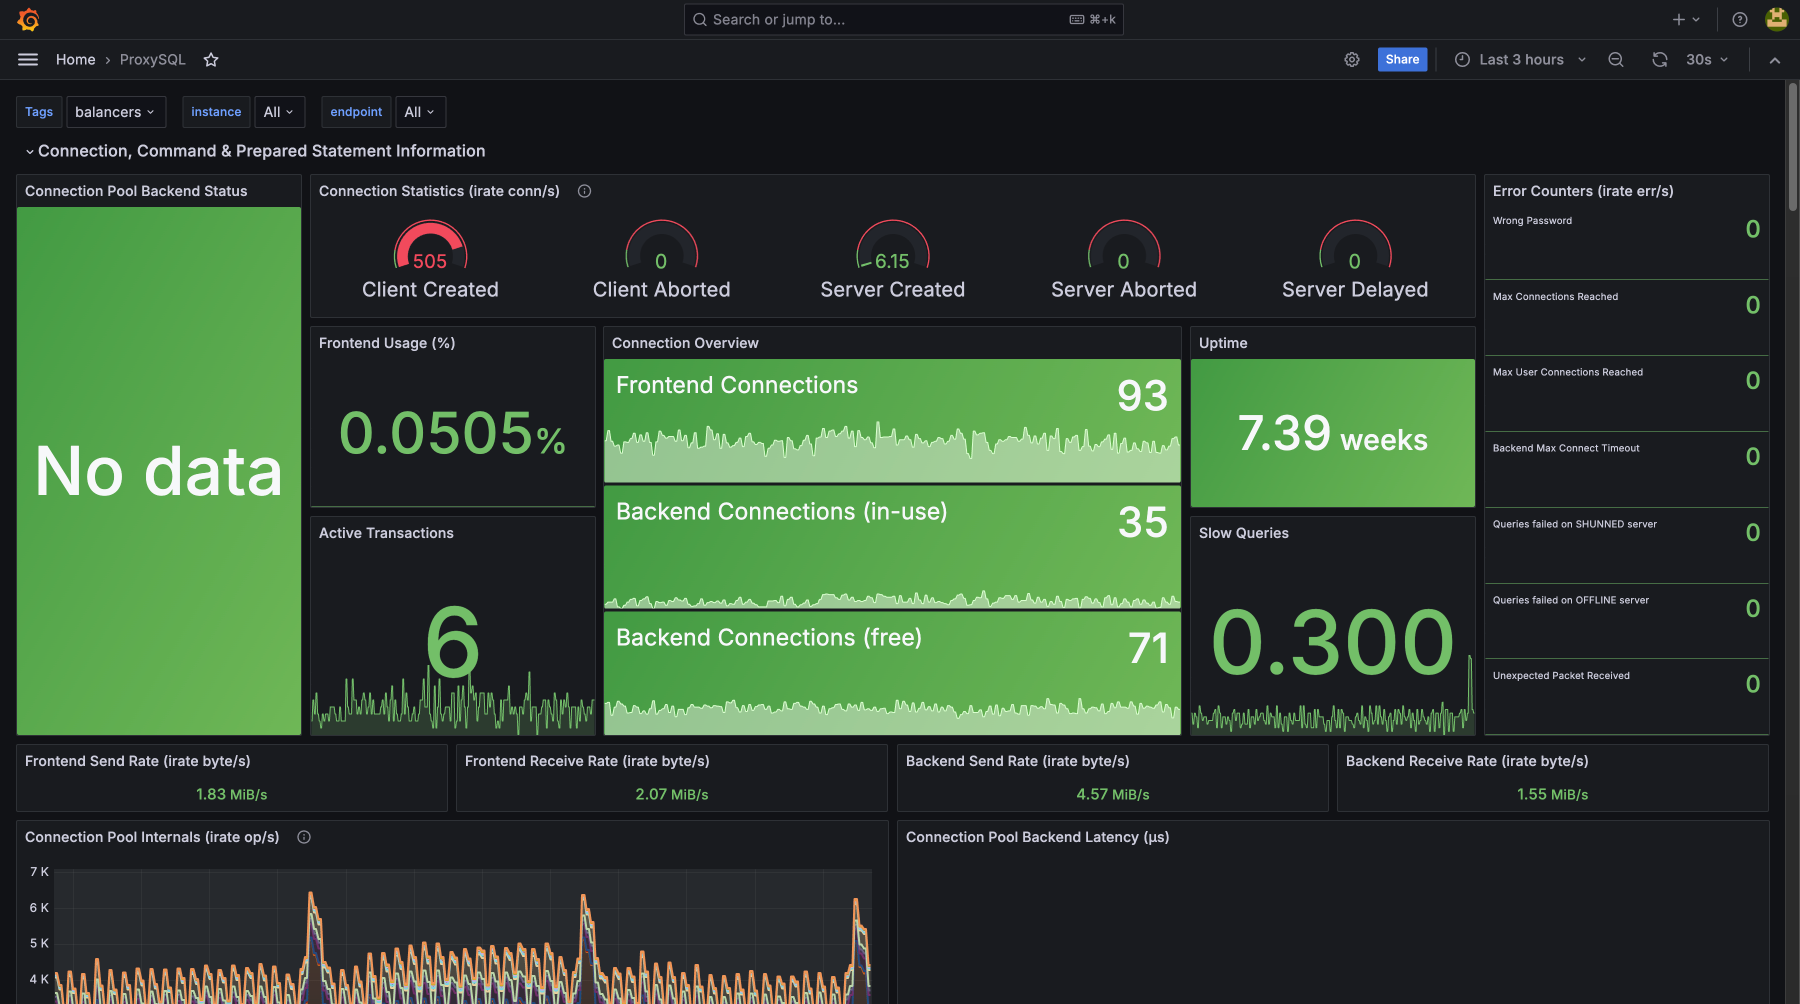
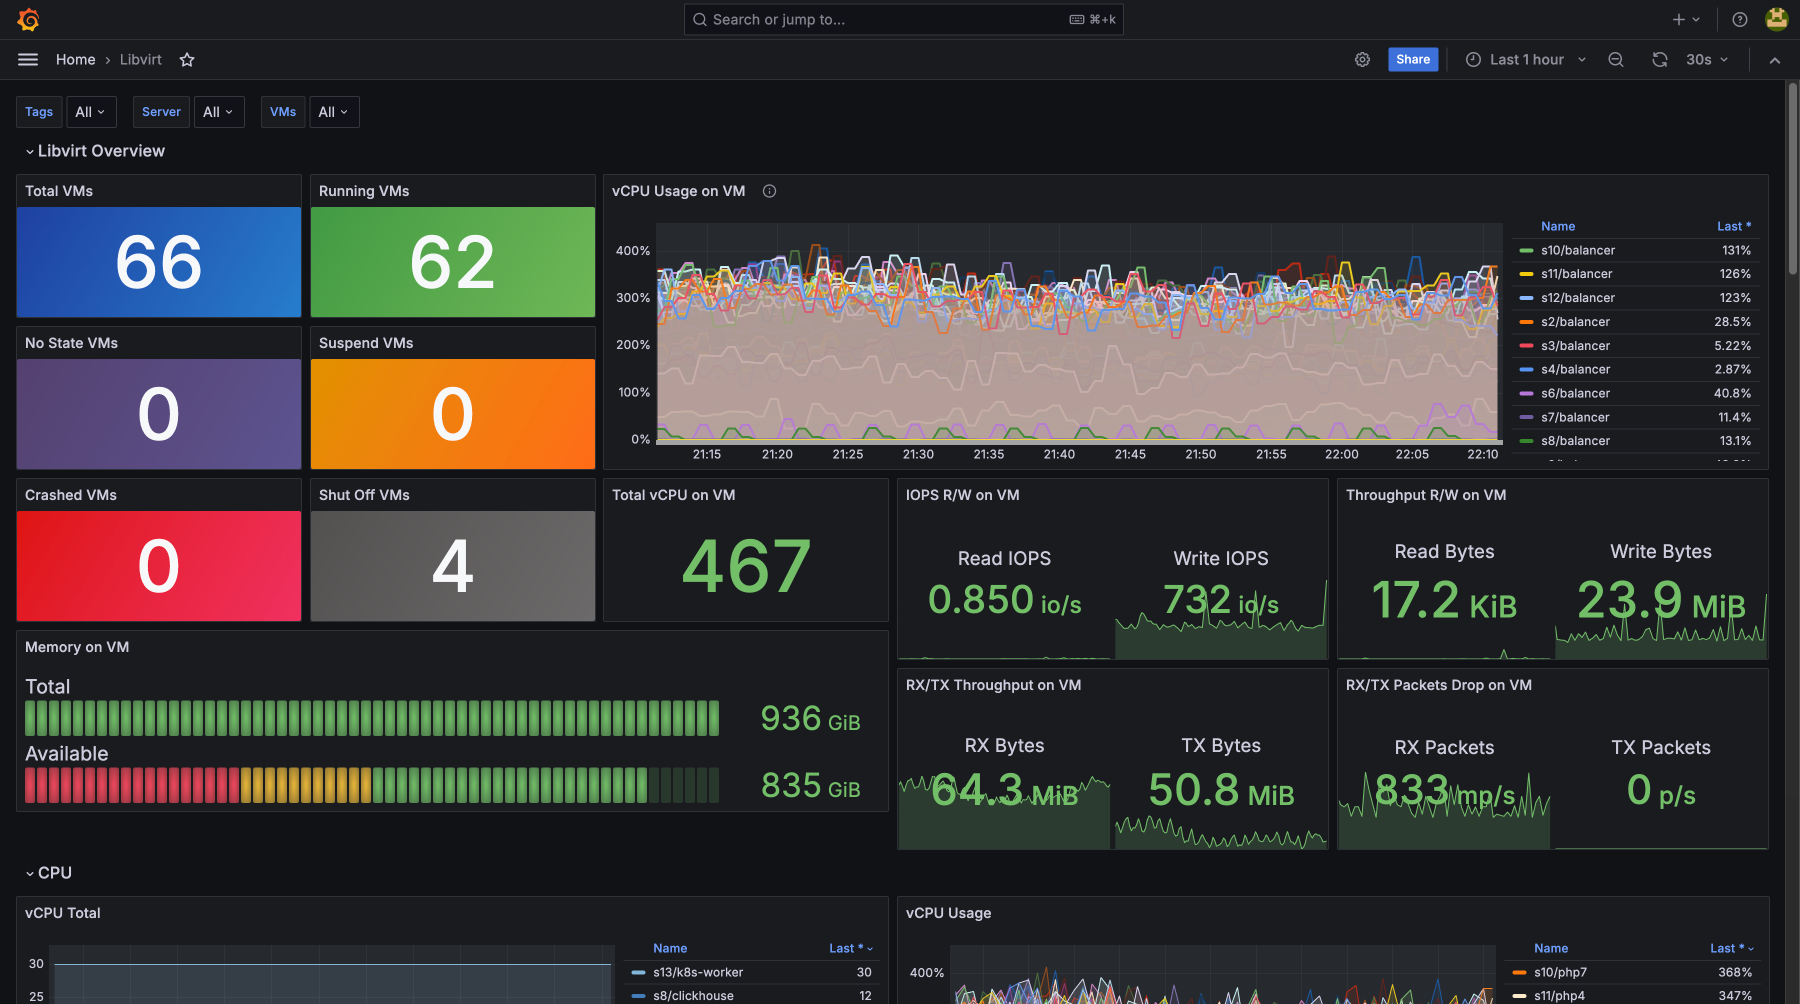
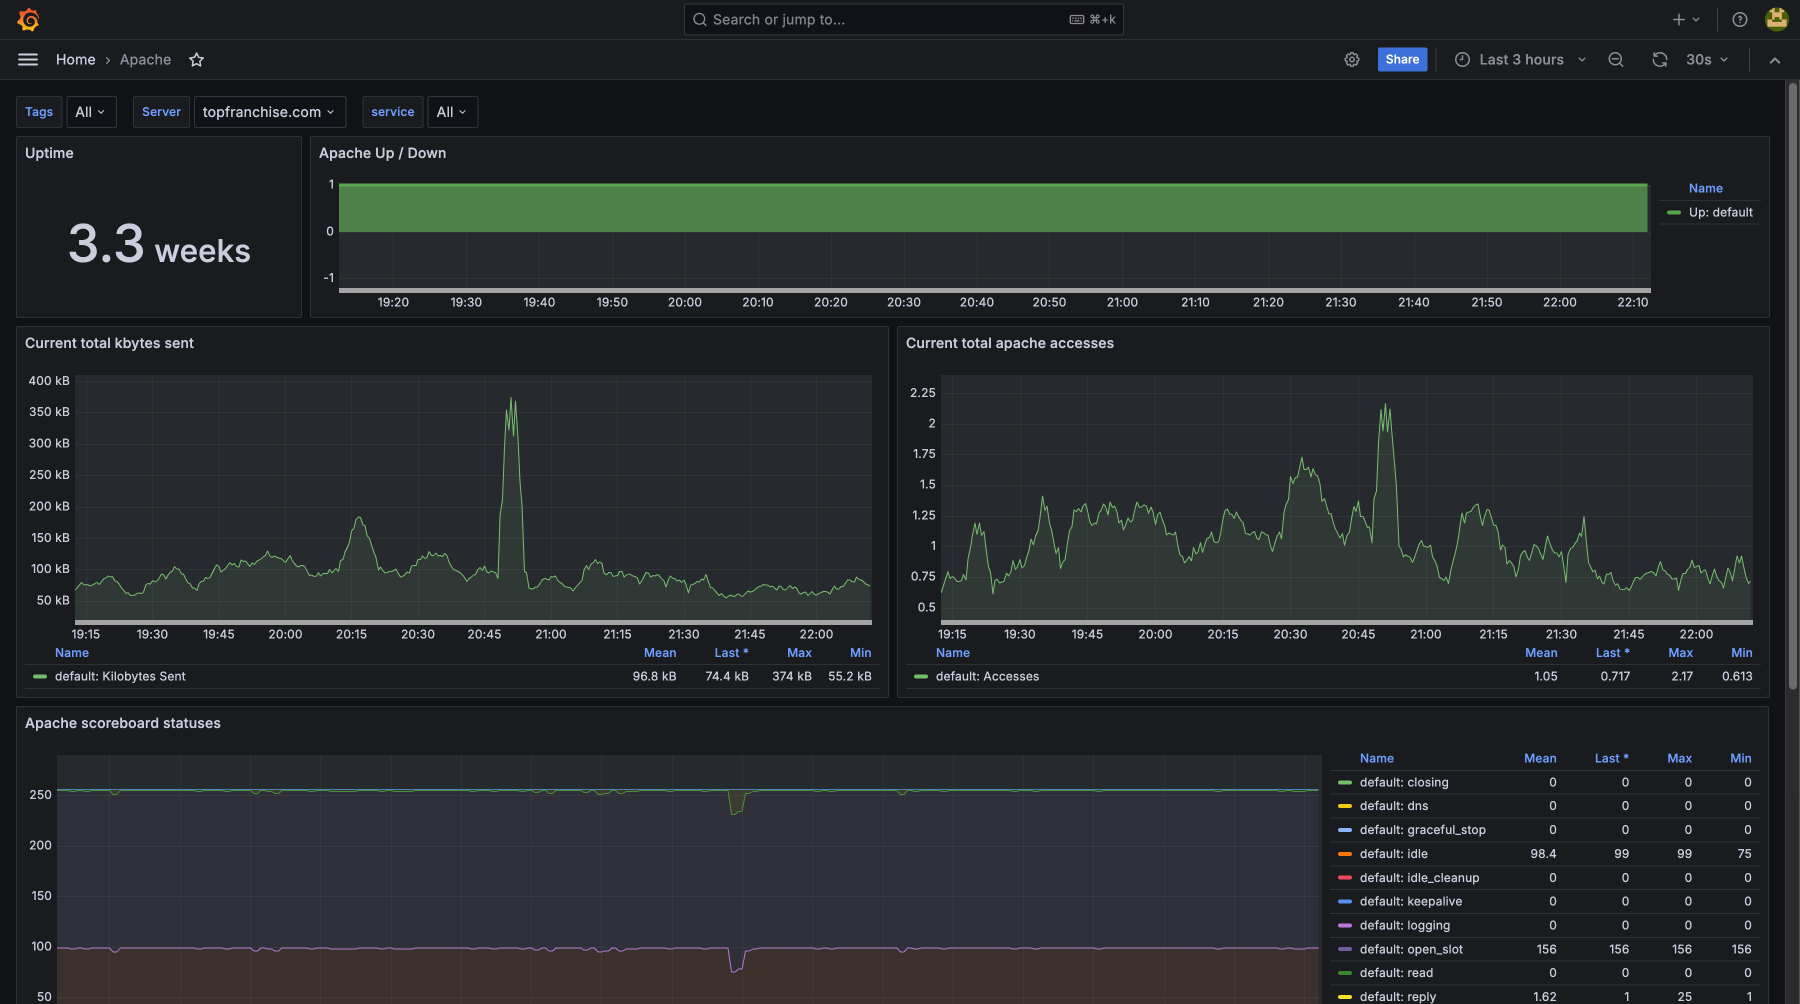
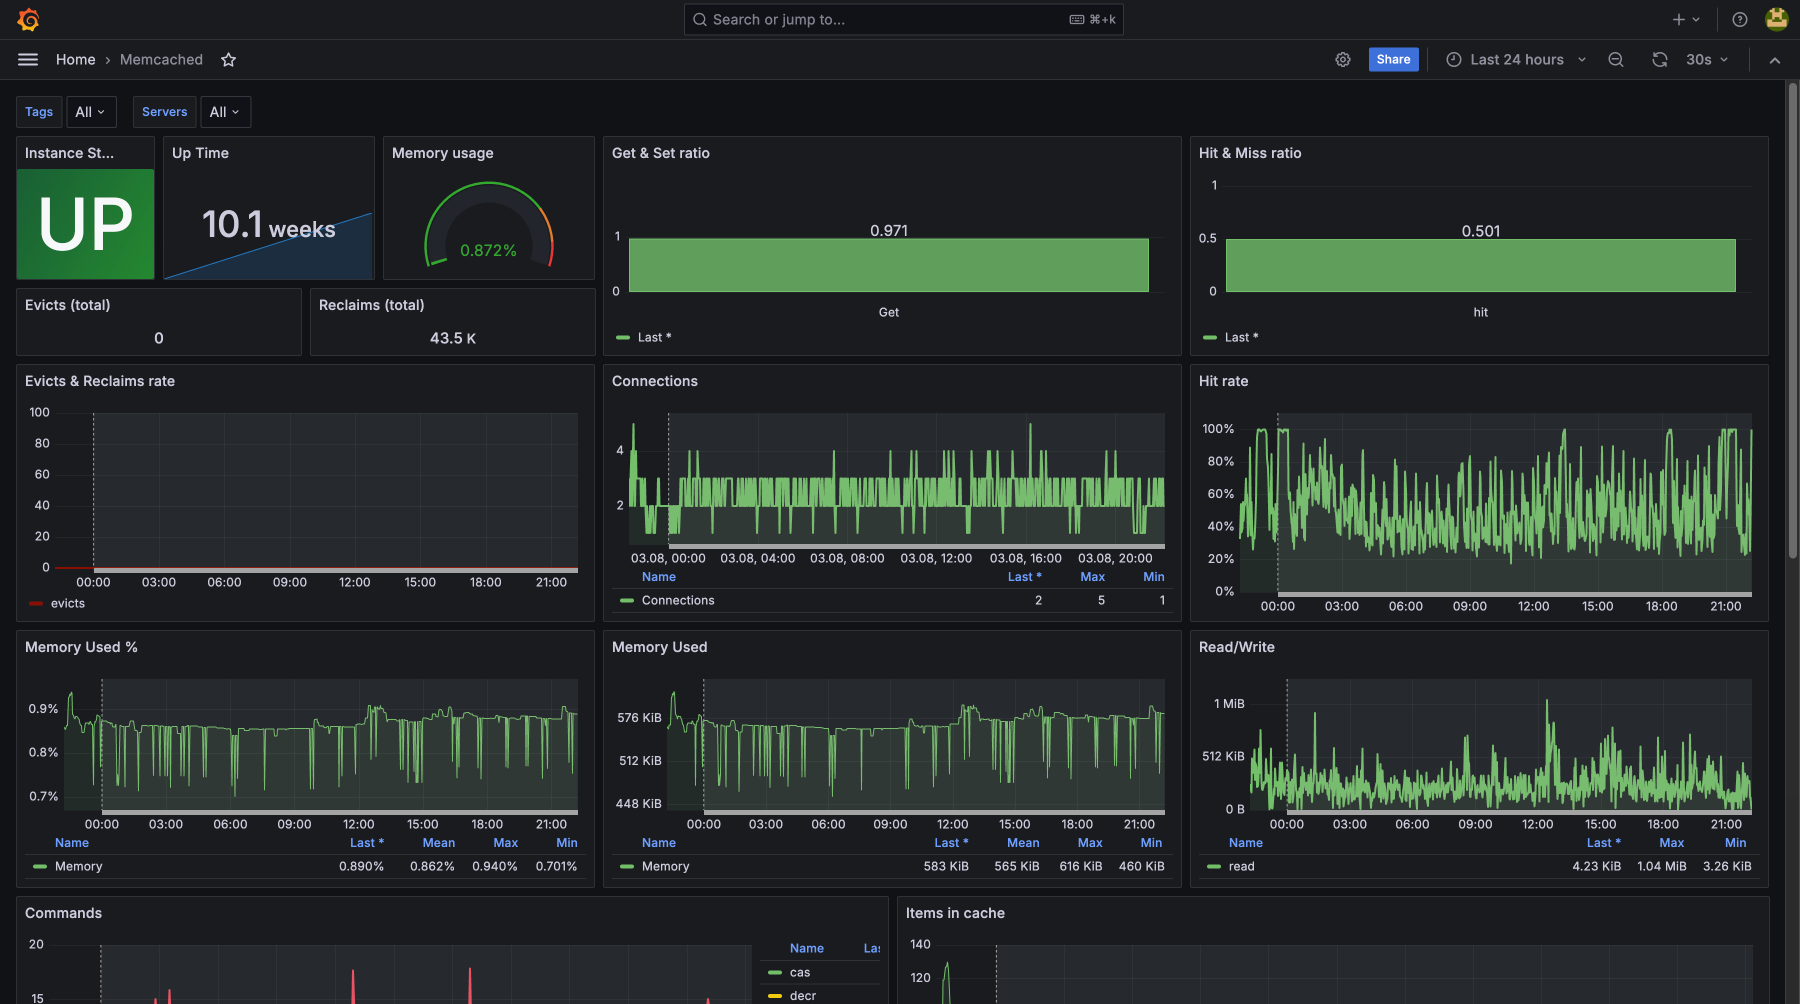
General Server Metrics with Detailed Breakdown for Each
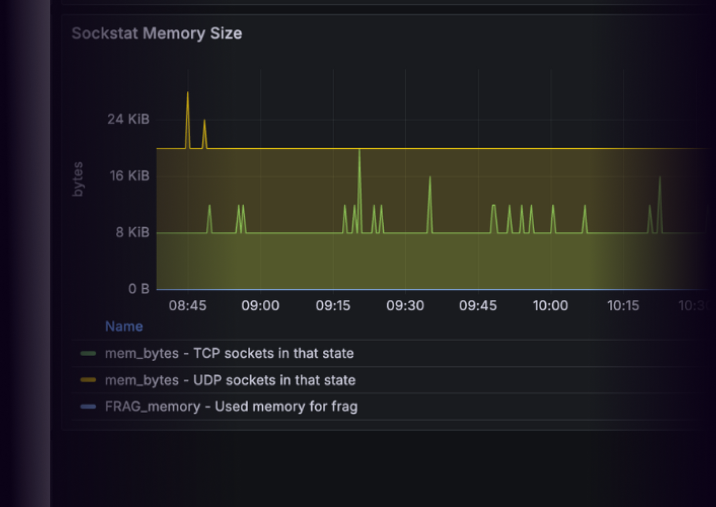
Advanced Monitoring
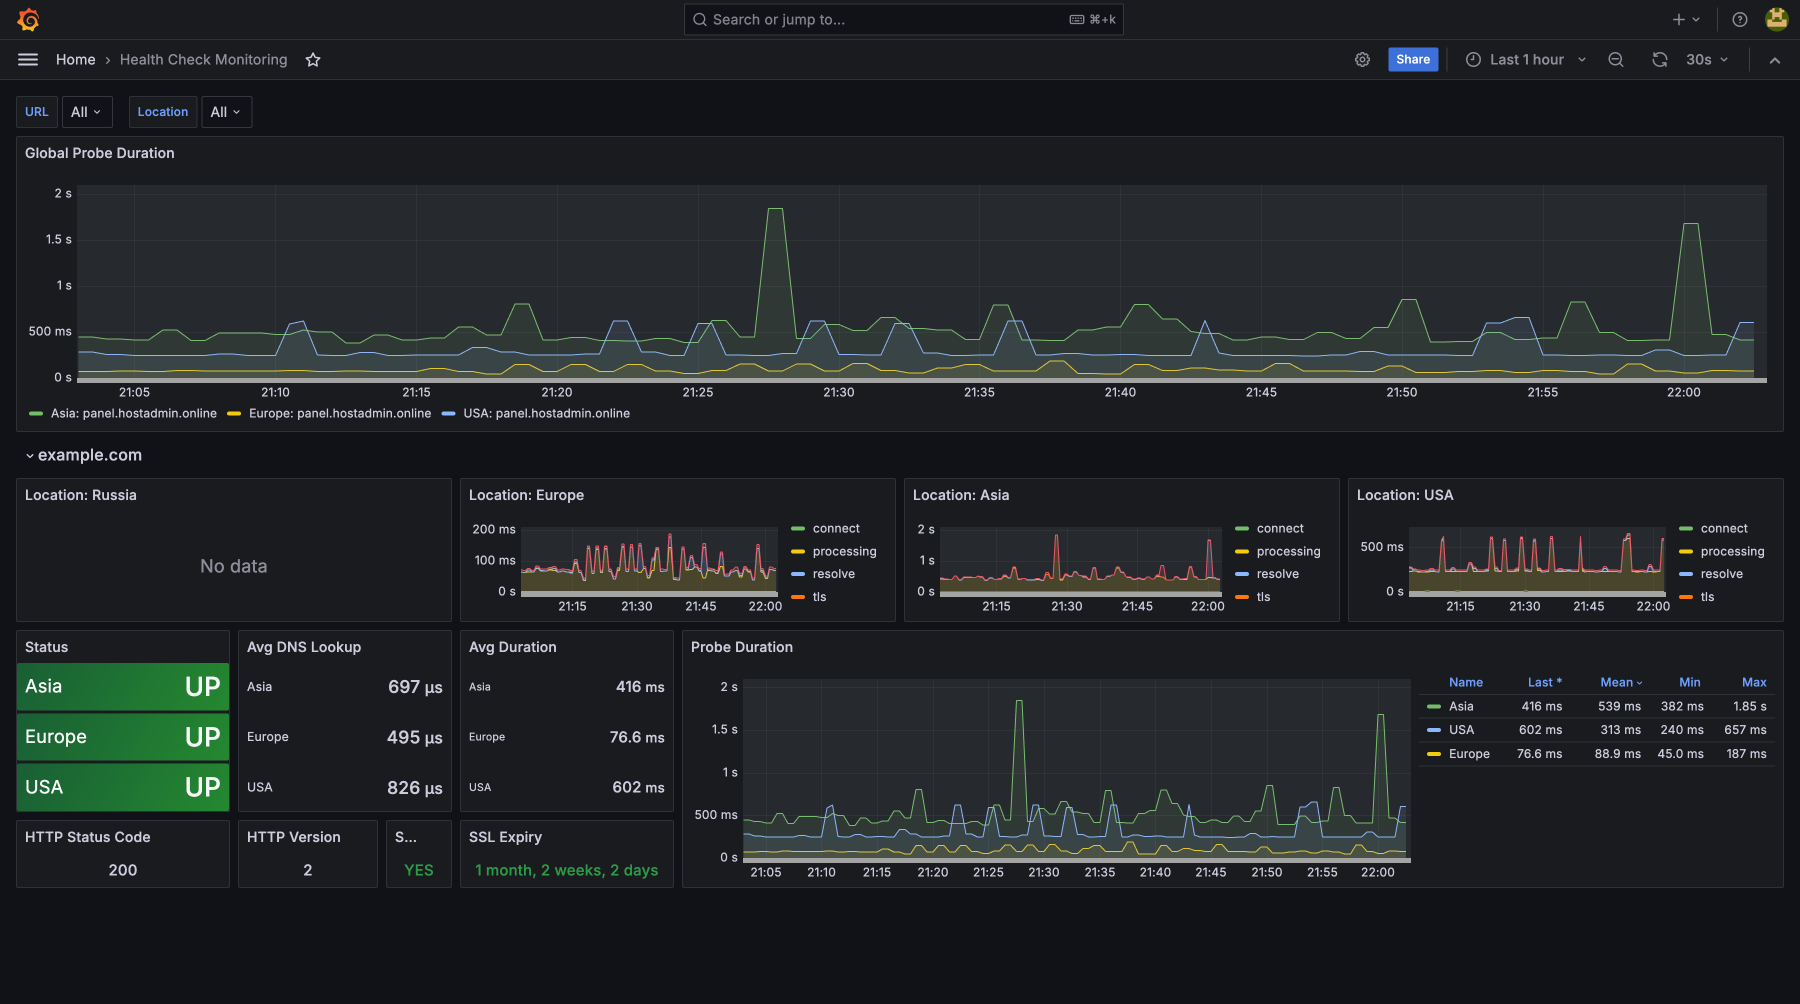
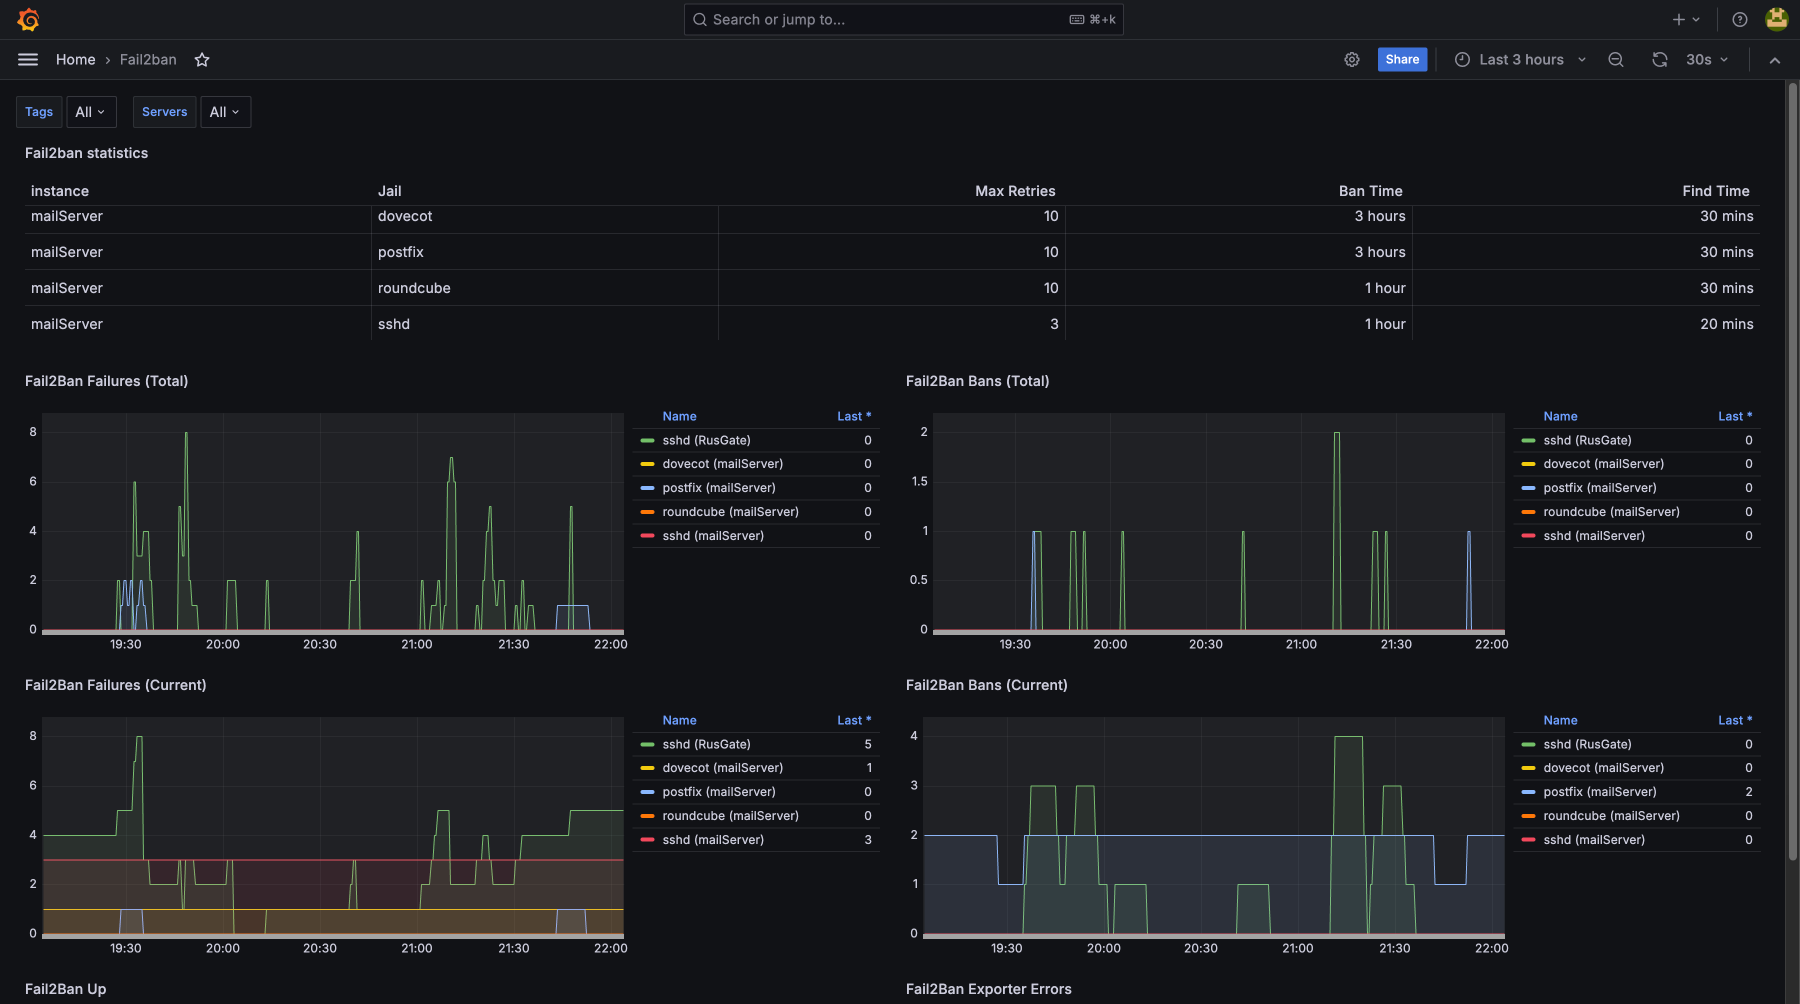
Service Monitoring
«If you need to monitor the availability of URLs, domains, and services — our Health Check Monitoring feature has you covered. It automatically checks whether endpoints are up and responsive, helping catch outages before users do. Additionally, it keeps track of domain expiration dates and SSL certificate validity, ensuring your services stay secure and uninterrupted»
Use theAI Assistant Services
Ask anything via Telegram and get step-by-step instructions from the AI
Connect Assistant